Measuring Value & Outcomes
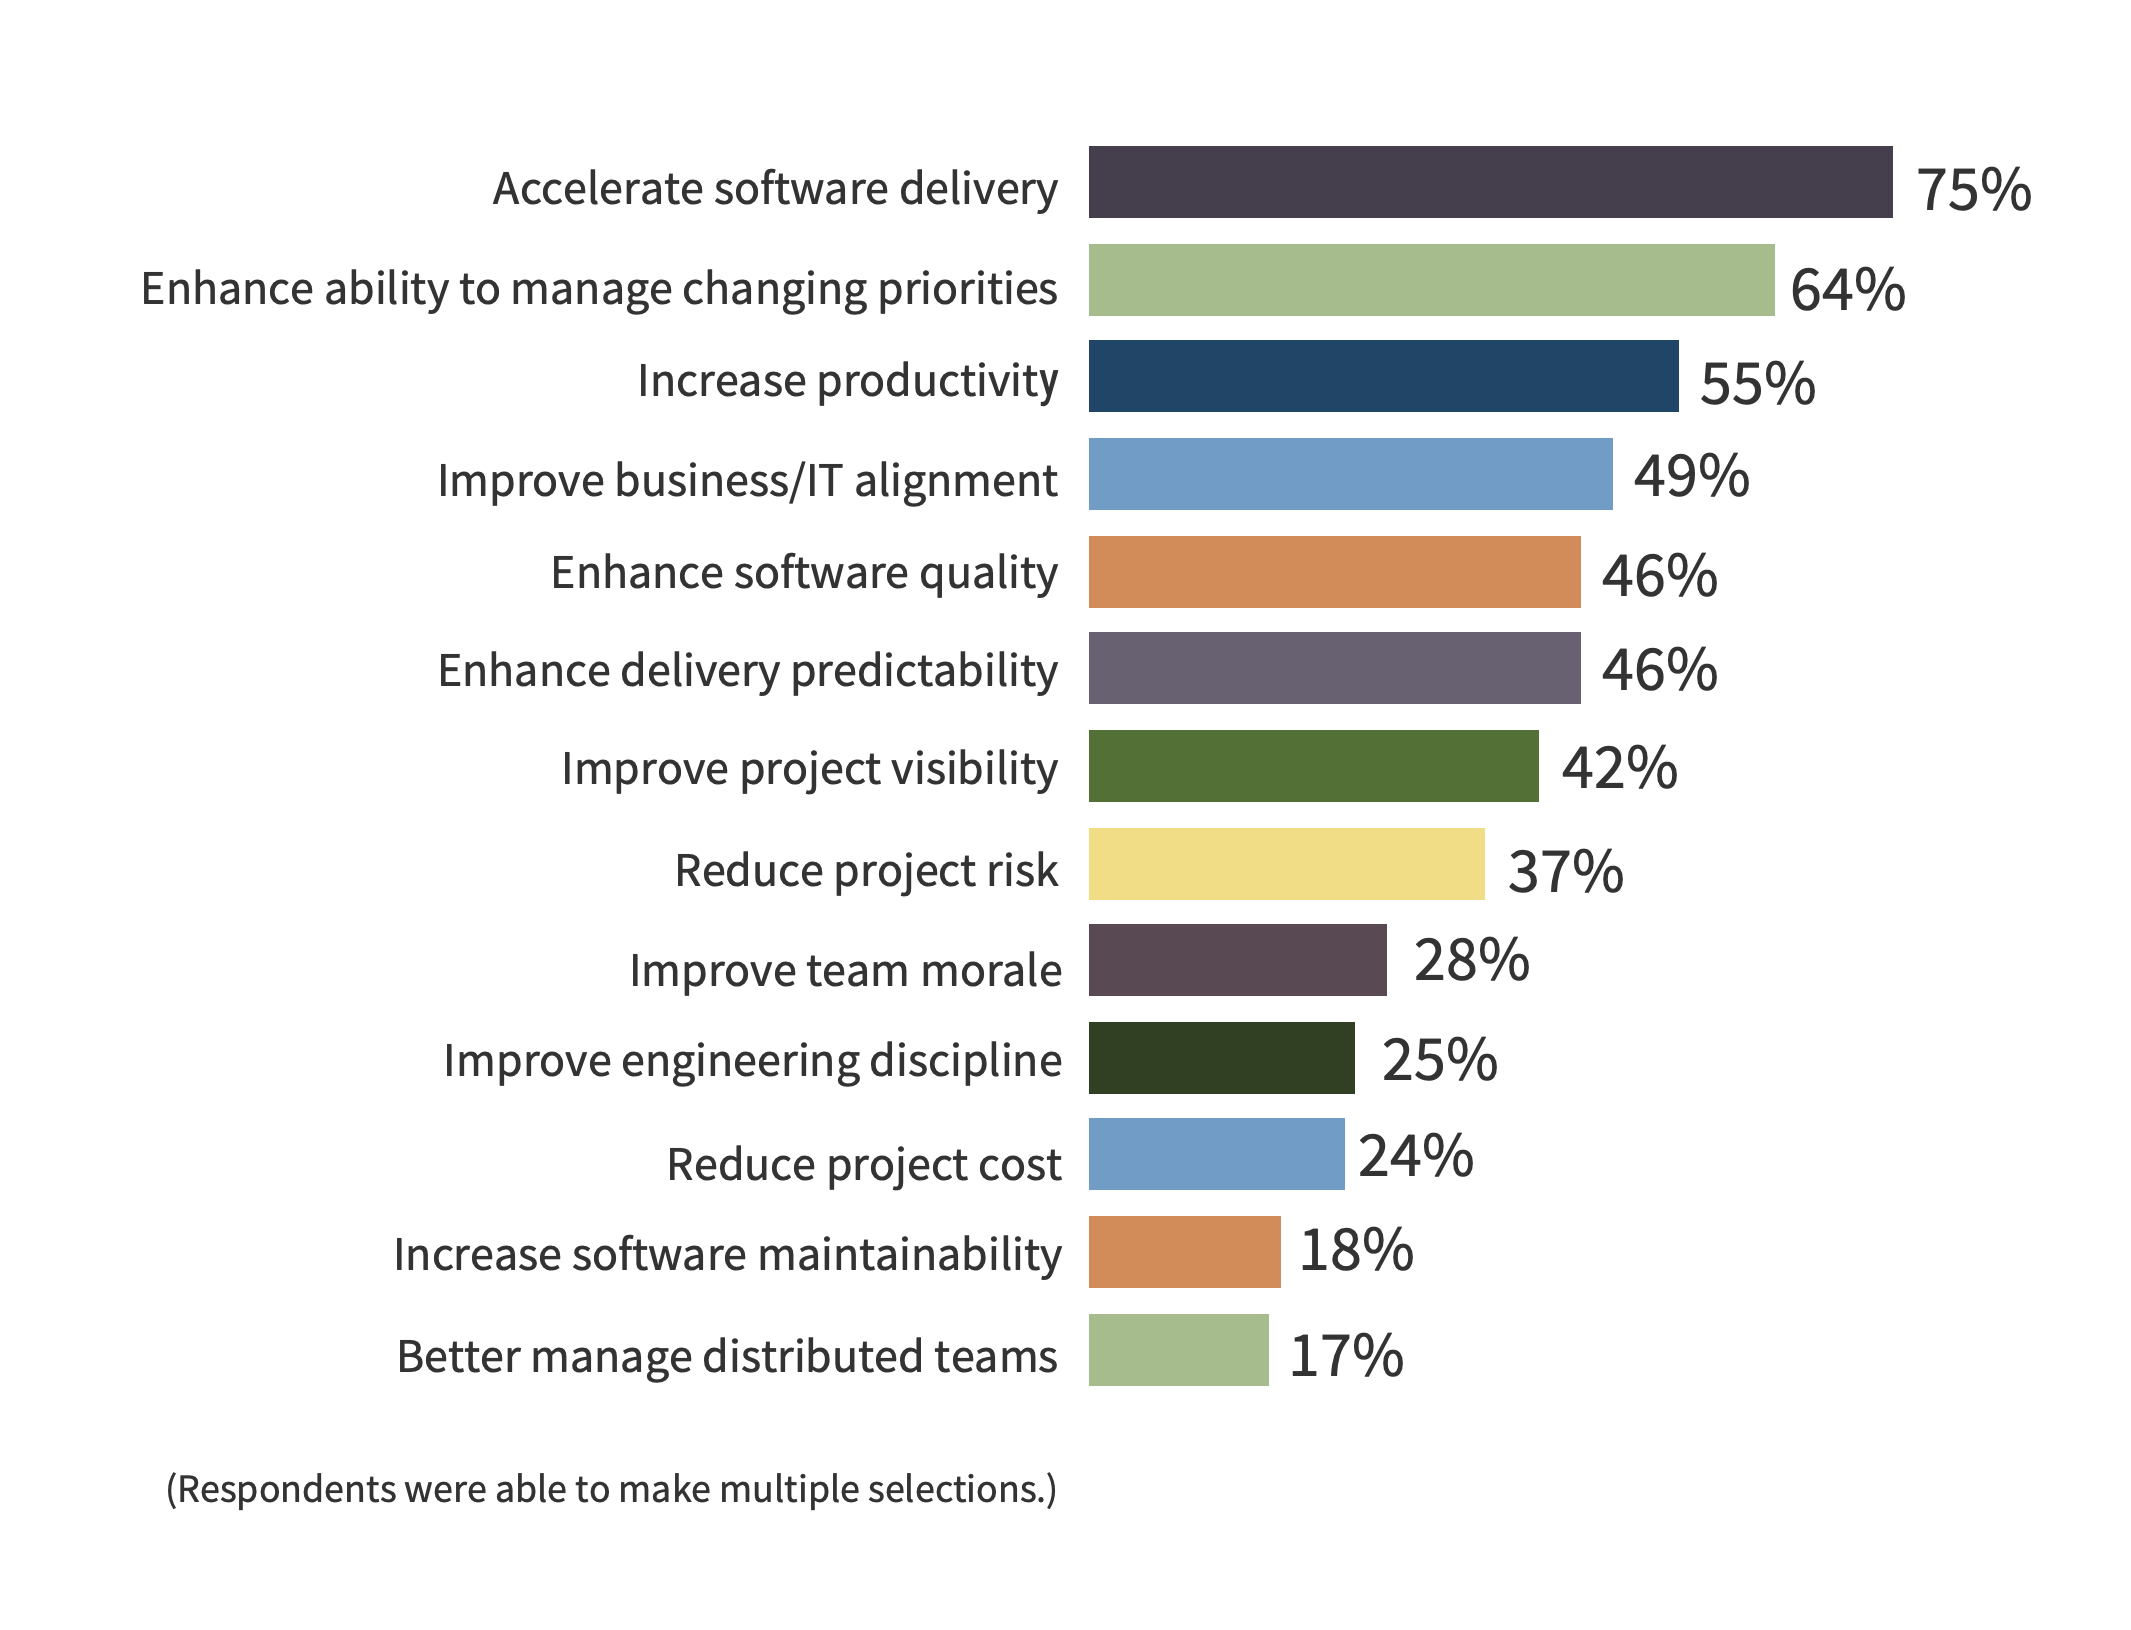
In Part 1 of this series, we discussed three primary metrics of an Agile transformation: value, flow, and quality, aligned with the roles of scrum: PO, SM, and Dev Team, respectively. While these may be considered geek metrics, they do eventually align with ultimate business performance when financials are available months or quarters later. Furthermore, they remain somewhat abstracted from the reasons why organizations choose to implement Agile (see the graph below.) In this article, we explore the value & outcomes category of metrics to holistically steer an organization.
Benefits of implementing Agile1:
Value and outcome-based metrics
How often do we develop a product, software, or capability that we think is the greatest thing since sliced bread, but nobody uses it? "Develop it, and they will come" was the old mantra of many technologists. The problem is that most business plans fail; in fact, 90% of new businesses fail, and those that do survive do so because they pivot to deliver whatever their first prospective customers truly need.2
The Lean Startup movement is ALL about continuous validation of business plan hypotheses, to aggressively pivot when the market feedback is to go in a different direction. Feedback needs to be daily, and ability to respond could be a few days later. Daily. Not weekly or monthly or a quarter later. The financial burn rate for a typical team of 7 people is on the order of $4,000 per work day. In today's world, we must limit our losses. We can do this through continuous exploration and testing our business case risks as rapidly as we possibly can.
Most hypotheses are something of the "If we build it, they will come" sort. Investors need objective proof that this is true before investing the next round of capital. We are all moving from a cap-ex to op-ex world of decision making, as the finance community places increasing emphasis on the importance of free cash flow. The best organizations respond by investing in "leading indicator" metrics, telemetry, and frequent releases of working software. Usage statistics can provide direct objective measures and validation of each feature hypothesis from day one. This practice enables organizations to make micro-portfolio decisions in real time rather than waiting after extended periods of investment.
When we don’t have daily usage statistics, proactive organizations use proxy leading indicators; often these come in the form of tracking Agile practices. There are many Agile practice maturity matrices available, including Eliassen's Enterprise and Team Level Agile Maturity Matrix.
Measures of Value Maximization: Leading vs Lagging metrics
By the time business results are available, a month or a quarter later, much time has gone by, many people have invested significant effort, reputation is on the line, the organization is vested, and to pivot is hard. By collecting leading indicator information, organizations build new competitive capability in the ability to adjust and adapt seamlessly, to become more and more responsive, and to maximize business value.
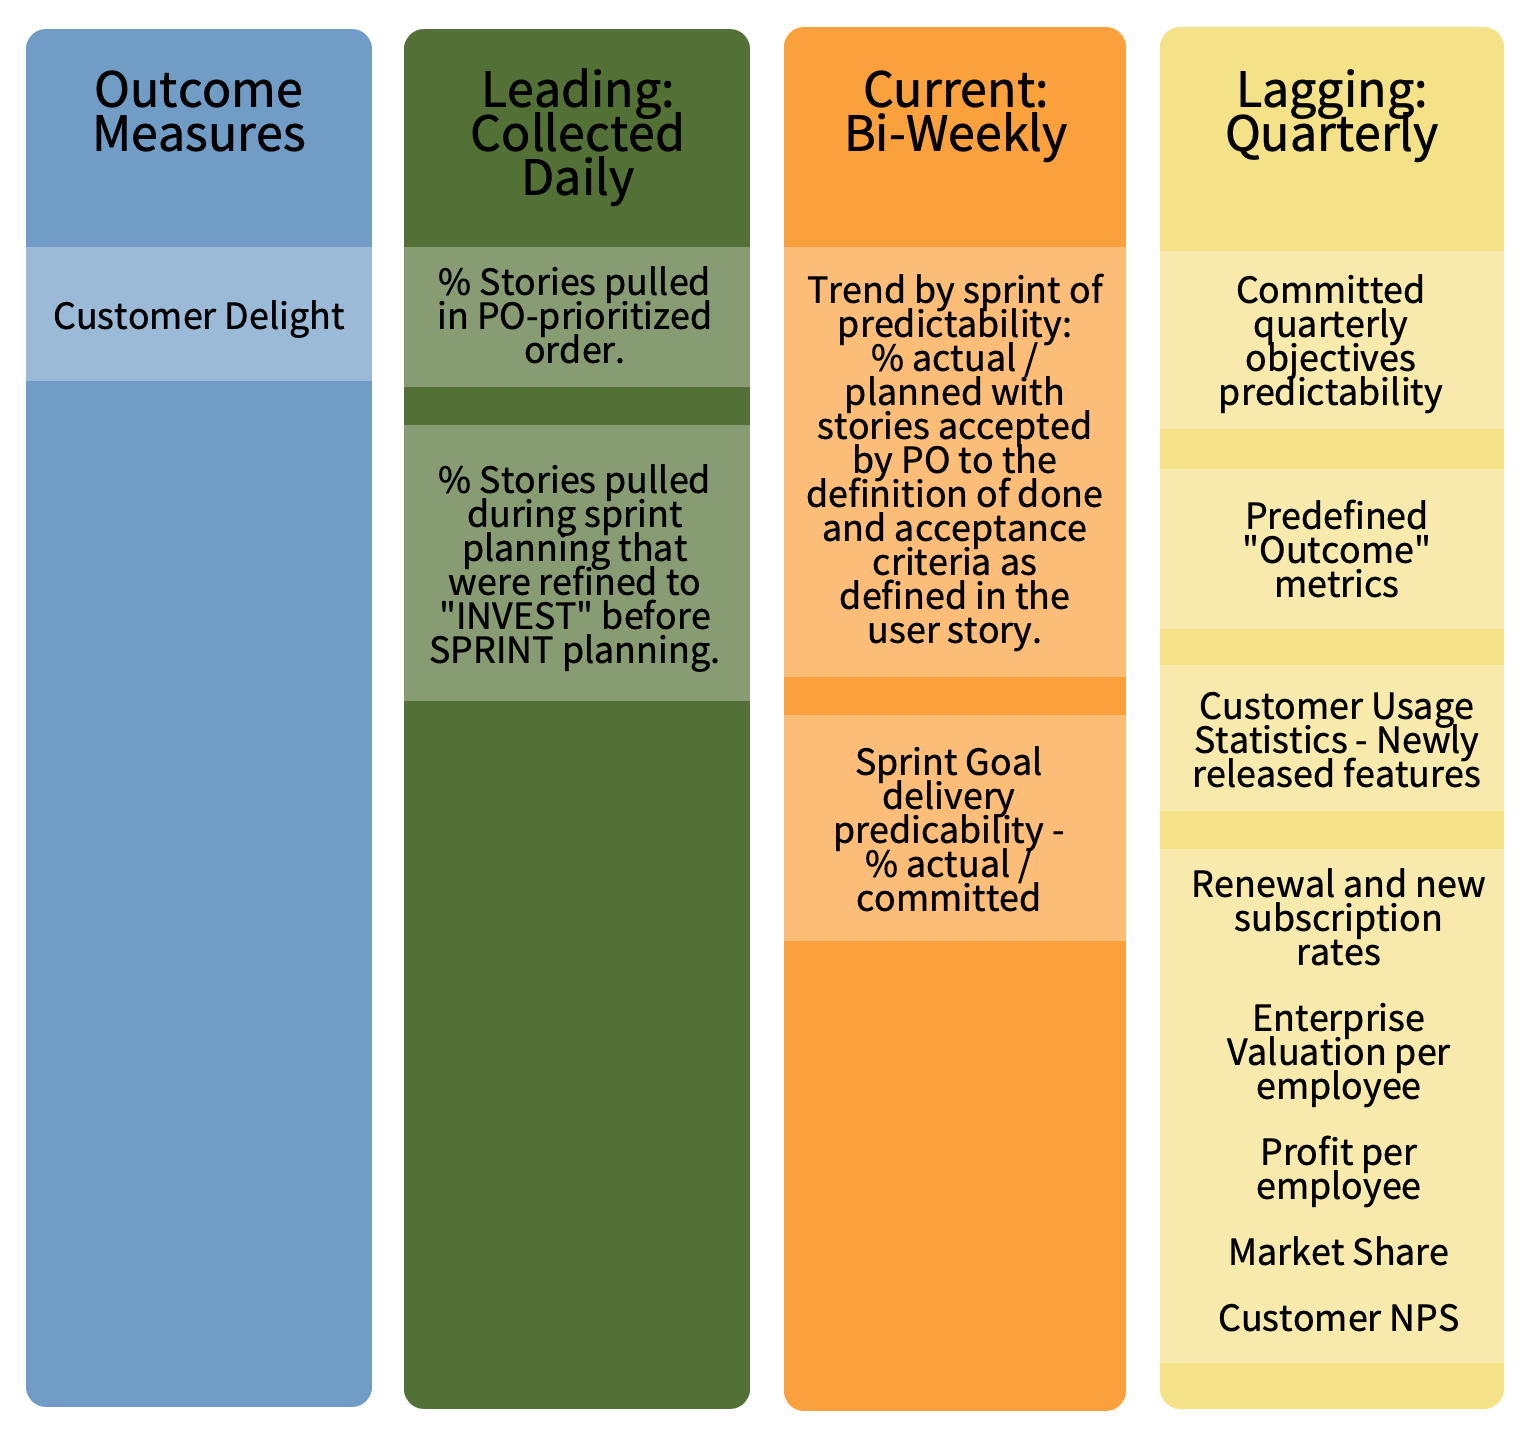
Practices most aligned with value maximization are well-formed stories, refined through a conversation between Product Owner and Development Team to INVEST. The acceptance of stories by the Product Owner is based on story acceptance criteria and the team definition of done.
A good current measure of value maximization is percent predictable delivery of SMART (specific, measurable, attainable, realistic, timebound) sprint goals. The transparency of teams’ successful delivery of their goals each sprint reinforces the value of incremental delivery and builds the involvement of business people and stakeholders of the program with the technical development and IT teams.
Good lagging measures of value maximization are customer adoption, usage frequency by feature, and customer NPS. Best practices are to measure desired outcomes, as defined in each feature hypothesis statement, through telemetry built into the product. The greatest lagging metrics are the enterprise’s financial results: revenue, margins, working capital, and enterprise valuation.
Based on control system theory and supported by many case studies, the best feedback system will have all three: leading, current, and lagging metrics across its major dimensions. When these Agile metrics are assembled together and discussed holistically -- and if they cover multiple dimensions of Agile metrics for leadership -- they provide transparency and an important decision-making platform. This enables all stakeholders to inspect and adapt more effectively, as well as to optimize their investments and satisfy all success criteria of the organization.
Examples of value & outcome-based metrics across time frames of leading, current, and lagging

In our next article of this series, we will discuss the flow dimension, which manifests as cycle time and feedback for the value delivery system from idea generation through customer adoption. Start measuring your own Agility with our Enterprise Agility Maturity Matrix, or view Eliassen Group's Agile consulting services.
- 12thAnnual State of Agile Report. 2018, https://explore.versionone.com/state-of-agile/versionone-12th-annual-state-of-agile-report
- Reis, Eric. The Lean Startup: How Today’s Entrepreneurs Use Continuous Innovation to Create Radically Successful Businesses. Crown Business, 2011.


